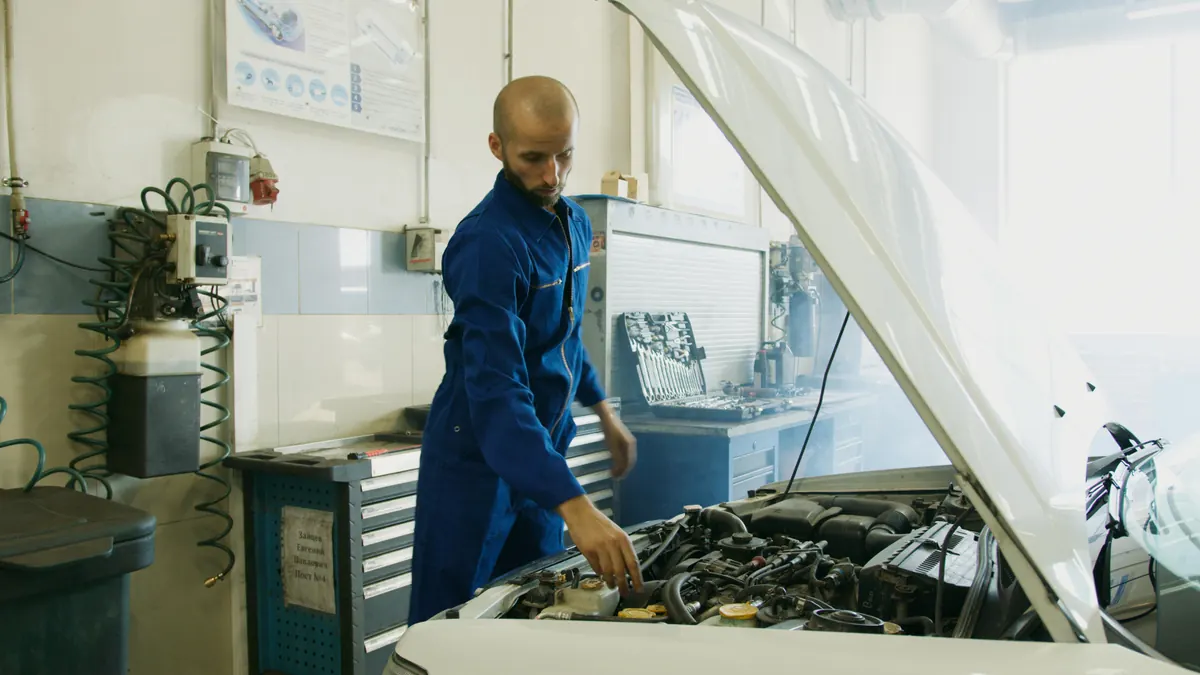
The DVSA publishes annual data on MOT outcomes covering every test conducted across England, Scotland and Wales. That dataset, now spanning over two decades, is one of the most detailed national vehicle condition records in the world. This page analyses the raw numbers: how many vehicles fail, which categories produce the most failures, how rates vary by vehicle age, make, fuel type and region, what COVID did to the statistics, and what the data tells us about the real-world condition of the UK vehicle fleet.
Test Volumes and the 23 Percent Headline
The DVSA annual vehicle testing statistics cover all MOT tests conducted in England, Scotland and Wales. In the most recent pre-disruption year before the COVID-19 pandemic, approximately 40 million tests were issued annually, covering both cars and light goods vehicles. Of those, the recorded first-time failure rate for cars specifically sits at approximately 23 percent according to DVSA published data, though some analyses of the full vehicle fleet including vans and motorcycles push the combined figure closer to 33 percent. The difference reflects how the denominator is defined: car-only figures are more favourable because cars are generally newer and better maintained than the commercial vehicle fleet.
At 23 percent, roughly 7.5 million car MOT tests result in a failure each year. That volume of failures generates a significant economic cost, estimated at over two billion pounds annually when retest fees, emergency repair premiums, and associated transport disruption are totalled. The majority of those failures are for defects that were present before the test and were detectable with basic inspection.
Northern Ireland operates a separate DVA scheme with its own testing infrastructure and data reporting. Adding Northern Ireland brings the total UK figure to approximately 41 million tests per year. The DVA records show broadly similar failure rate patterns to the DVSA data, though the Northern Irish fleet has some distinctive characteristics including a higher proportion of older diesel vehicles.
Top Failure Categories by Volume
The DVSA classifies all MOT defects into standardised categories. The relative frequency of each category has remained broadly stable over the past decade, though the 2018 test overhaul and post-2020 fleet ageing have introduced some shifts. The following table shows the approximate share of all MOT failures attributable to each major category, based on DVSA published data and independent analysis of the open testing dataset.
| Failure Category | Approx. Share of All Failures | Most Common Specific Item | Typical Fix Cost |
|---|---|---|---|
| Lighting and signalling | 18% | Blown bulb (brake light or headlight) | Under £10 DIY |
| Brakes | 10% | Brake pads below minimum / imbalance | £80 to £250 per axle |
| Suspension | 7% | Worn ball joints / shock absorbers | £100 to £400 |
| Tyres | 6% | Tread depth below 1.6mm | £60 to £120 per tyre |
| Driver visibility | 4% | Windscreen crack / wiper failure | £20 to £300 |
| Emissions | 4% | DPF smoke (diesel) / cat failure (petrol) | £150 to £1,500+ |
| Bodywork and structure | 3% | Corrosion near structural mounting | £200 to £2,000+ |
| Seatbelts | 2% | Faulty buckle / frayed webbing | £50 to £150 |
| Exhaust / fuel system | 2% | Exhaust blowing / leaking | £80 to £500 |
| Number plates / other | 1% | Illegible plate / non-standard font | Under £30 |
Lighting dominates the table despite being the cheapest and most easily preventable category. A blown bulb costs under five pounds and takes ten minutes to replace, yet lighting defects generate more failures than any other category year after year. The primary reason is that a blown rear brake light is invisible to the driver from inside the vehicle. Drivers who do not routinely walk around their car with all lights on will not know the bulb is blown until the tester records it.
Emissions failures, by contrast, tend to produce some of the highest repair costs when they do occur. A diesel DPF replacement can run to over one thousand pounds. A catalytic converter on a petrol vehicle can cost several hundred. These are not cheap fixes, yet they are largely preventable with appropriate engine management and driving habits.
What Percentage of Failures Are Simple and Cheap to Fix?
Analysis of DVSA failure data by category and typical repair cost suggests that approximately 35 to 40 percent of all first-test failures are for items that could be rectified for under fifty pounds. This includes blown bulbs, worn wiper blades, cracked number plates, minor windscreen chips outside the primary field of vision, and low or contaminated washer fluid. These are maintenance items that most drivers could address themselves in under an hour with basic tools and parts available from any motor factor or online retailer.
A further 30 to 35 percent of failures are for items in the fifty to three hundred pound range, including brake pads, single tyres, simple suspension components, and exhaust sections. The remaining 25 to 30 percent involve more significant repairs including emissions system components, structural corrosion, and multiple simultaneous failures on older vehicles.
Failure Rate by Vehicle Age
Vehicle age is the single most powerful statistical predictor of MOT outcome. The correlation is strong, consistent across all data sources, and holds regardless of manufacturer, fuel type, or original purchase price. The following table shows the approximate first-time failure rate at each age bracket, based on DVSA data and independent fleet analyses.
| Vehicle Age | Approx. First-Test Failure Rate | Primary Failure Categories |
|---|---|---|
| 3 to 4 years (first MOT) | Under 15% | Lighting, tyres |
| 5 to 7 years | 20% to 25% | Lighting, brakes, tyres |
| 8 to 10 years | 28% to 33% | Suspension, brakes, lighting, emissions |
| 10 to 14 years | 35% to 40% | Suspension, corrosion, emissions, brakes |
| Over 15 years | 40% or above | Corrosion, suspension, brakes, emissions, multiple simultaneous |
A three-year-old vehicle maintained under a manufacturer's warranty scheme typically achieves a first-test pass rate above 85 percent. These are modern vehicles with minimal mechanical wear and, in most cases, recent dealer servicing that will have caught obvious defects before the test. The most common failures in this age group are lighting defects and tyre tread, both of which reflect a simple failure to check rather than any fundamental vehicle deterioration.
The picture changes significantly by the eight-to-ten-year bracket. In this window, rubber suspension components, which have a finite lifespan regardless of mileage, are beginning to perish. Shock absorbers are approaching or past their effective service life on vehicles used in normal urban driving. Brake discs may be on their second or third replacement cycle and showing signs of lipping or corrosion. Vehicles in this bracket require more proactive maintenance to achieve a clean first-time pass.
Beyond ten years, the statistics diverge sharply between well-maintained and poorly maintained examples. A ten-year-old car with a verifiable full service history and prompt attention to previous MOT advisories can still achieve a first-time pass rate approaching 70 to 75 percent. A ten-year-old car with no service history, deferred maintenance, and accumulated advisories may fail across multiple categories simultaneously. This divergence is why a detailed MOT history check is essential before buying any vehicle over seven years old.
First-Time Owner Failure Patterns
DVSA data and fleet analysis reveal a distinct failure pattern associated with first-time ownership of older vehicles. When a vehicle changes hands to a buyer who has little experience of the model, the first MOT under their ownership tends to show a higher failure rate than subsequent tests. This reflects the new owner's learning curve on the vehicle's specific maintenance requirements, combined with any deferred maintenance inherited from the previous owner. Vehicles sold at auction or through private sale without service history are particularly prone to this pattern.
Diesel, Petrol and EV Comparison
Fuel type produces measurable differences in failure rates, and the profile of failures by type is distinctive. The following comparison draws on DVSA category data and independent fleet analyses to quantify the differences.
Diesel Vehicle Failure Profile
Diesel vehicles have shown consistently elevated emissions failure rates since the 2018 MOT test revision tightened the standards applied to diesel particulate filter (DPF) performance. Prior to 2018, a diesel could pass the numerical exhaust gas test even if it occasionally produced visible smoke during DPF regeneration cycles. The post-2018 standard added an automatic failure for any visible smoke under acceleration, regardless of the numerical result. This change had an immediate and measurable impact on diesel failure rates.
Diesel vehicles also tend to show higher failure rates on suspension components at a given age, partly because diesel powertrains are heavier and place greater stress on front suspension components. Turbocharged diesel engines produce higher torque loads that accelerate wear in drivetrain components including engine mounts and gearbox mounts, both of which are MOT items.
- Diesel failure rate for emissions: approximately 6 to 8 percent, versus under 3 percent for equivalent-age petrol vehicles
- DPF-related failures account for the majority of diesel emissions failures, rising sharply for vehicles over seven years old
- Diesel vehicles with high urban mileage (low motorway proportion) are most at risk of DPF blockage and failure
- EGR valve failures are a secondary diesel emissions failure item, particularly on turbodiesel engines used predominantly in stop-start urban driving
Petrol Vehicle Failure Profile
Petrol vehicles generally show lower emissions failure rates than diesels. Catalytic converter failures, which are the primary petrol emissions failure item, become more common after ten years of use but are significantly less prevalent than DPF failures in equivalent-age diesel vehicles. The broader failure profile for petrol vehicles is dominated by lighting, tyres, and suspension, following the general pattern of the fleet.
Petrol vehicles with direct injection engines (GDI, TFSI, TSI) are beginning to show elevated emissions failures as they age, linked to oil contamination of intake ports reducing fuel combustion efficiency. This is an emerging category that is expected to grow as direct-injection petrol vehicles reach the eight-to-twelve-year age bracket in larger numbers.
Electric Vehicle MOT Data
Electric vehicles became subject to mandatory MOT testing three years after first registration, following the same schedule as conventional vehicles. The MOT for an electric vehicle covers a different set of items from a combustion vehicle: there is no emissions test (as EVs have no exhaust), no fuel system check, and no assessment of the combustion engine. Instead, the test focuses on brakes, tyres, steering, suspension, lighting, bodywork, and the high-voltage warning system.
Early data on EV MOT pass rates is extremely encouraging. EVs in the three-to-five-year bracket are showing first-time pass rates significantly above the fleet average, consistent with the expectation that removing the combustion engine and its associated wear items reduces the number of potential failure points. The most common EV failures in early data relate to tyres and lighting, the same categories that dominate for petrol vehicles in the same age group.
One EV-specific consideration that has emerged in early testing data is brake performance. EVs use regenerative braking as the primary slowing mechanism under normal driving, meaning the friction brakes are applied far less frequently than on conventional vehicles. This can lead to brake disc and caliper corrosion on vehicles that rarely require hard braking, producing a paradoxical failure risk in a component that has been used less. EV owners should ensure the friction brakes are exercised regularly, particularly the handbrake and rear brakes.
Regional Pass Rate Variation
First-time pass rates vary measurably across the UK's regions, with differences of several percentage points between the best and worst performing areas. Understanding these patterns illuminates the relationship between vehicle maintenance, economic geography, and road environment.
London vs Rural Wales: The Extremes of the Distribution
London and rural Wales represent opposite ends of the regional pass rate distribution, for different reasons. London's overall first-time pass rate tends to be at or slightly above the national average in aggregate, driven by a fleet that includes a relatively high proportion of newer vehicles, lease cars, and low-mileage second vehicles. However, London vehicles show elevated rates of specific failure categories: brake pad wear is accelerated by heavy stop-start driving, tyre damage from potholed urban roads and kerbing is more frequent, and DPF failures are disproportionately common in diesel vehicles used predominantly in city traffic without sufficient motorway running to allow passive regeneration.
Rural Wales presents a very different picture. Pass rates in rural Welsh areas are consistently several percentage points below the national average. The primary drivers are an older average fleet age compared to affluent urban areas, heavy winter road salting on mountain and upland routes that accelerates underbody and structural corrosion, and a higher proportion of utility vehicles and agricultural-use vehicles in the testing fleet. Structural corrosion failures near seatbelt anchors and suspension mounting points are significantly more common in heavily salted areas than in parts of the country where road treatment is lighter.
| Region | Relative Pass Rate vs National Average | Dominant Failure Categories |
|---|---|---|
| South East England | Above average | Lighting, tyres (newer average fleet) |
| London | Broadly average (varies by area) | Brakes, tyres, DPF / emissions |
| East of England | Slightly above average | Lighting, suspension |
| South West England | Broadly average (coastal areas lower) | Corrosion in coastal areas, lighting inland |
| Midlands | Around average | Lighting, brakes, suspension |
| North West England | Slightly below average | Suspension, brakes, corrosion |
| North East England | Below average | Corrosion, suspension, emissions |
| Scotland | Below average (Highland especially) | Corrosion, suspension, bodywork |
| Wales | Below average (rural areas especially) | Corrosion, suspension, older fleet defects |
The regional pattern largely reflects three compounding factors: average fleet age, average road salt exposure, and average servicing frequency. Wealthier areas have newer fleets. Areas with harsh winters apply more salt. Areas with lower average incomes tend to have lower rates of professional servicing, meaning defects accumulate undetected between MOT tests rather than being caught and addressed at service intervals.
Manufacturer Reliability Rankings from MOT Data
The open DVSA testing dataset, combined with independent fleet analyses, enables reliability comparisons by manufacturer that are grounded in real-world testing outcomes rather than manufacturer-claimed reliability figures. The following summarises what the data consistently shows across multiple independent analyses.
Manufacturers with Consistently Above-Average Pass Rates
- Toyota: Consistently ranks at or near the top of pass-rate analyses across all age brackets. The Yaris, Corolla, and Prius models show first-test pass rates several percentage points above the national average when controlled for age. The brand's engineering culture prioritises long-term component reliability, which translates directly into fewer MOT failures.
- Honda: The Jazz, Civic, and CR-V record strong first-test pass rates in large-scale analyses. Honda diesel variants (particularly the i-DTEC engine) have shown marginally higher emissions-related failure rates since 2018 but overall Honda still outperforms the national average.
- Mazda: The Mazda3, Mazda6, and CX-5 perform consistently above average. Mazda's SkyActiv engine family has shown good long-term reliability in MOT data to date.
- Lexus: As Toyota's premium brand, Lexus vehicles show similarly strong pass rates. The hybrid powertrain models show very low emissions failure rates.
Manufacturers with Broadly Average Pass Rates
- Volkswagen Group (VW, Audi, Skoda, SEAT): Performance varies significantly within the group and by model. The Golf, Polo, and Skoda Octavia perform reasonably well in the five-to-ten-year bracket. TDI diesel variants show elevated DPF failure rates as they age. DSG dual-clutch gearbox issues have generated some advisory and failure items on higher-mileage examples.
- Ford: The Focus and Fiesta are among the most-tested vehicles in the fleet due to their volume. Both perform broadly at the national average. The 1.0 EcoBoost petrol engine shows good long-term emissions performance; diesel variants are more variable.
- Vauxhall: The Astra and Corsa occupy the middle of the table. Older Vauxhall diesel models (Z20DTH, CDTI) have shown above-average emissions failure rates due to DPF and EGR issues.
Manufacturers with Below-Average Pass Rates in Fleet Data
- Land Rover (older models): Older Freelander 2 and Discovery 3 and 4 models show notably elevated failure rates driven by air suspension failures on the Discovery and Range Rover variants, DPF issues on TDV6 engines, and complex suspension systems prone to corrosion in the underbody. Modern Land Rover models are less affected.
- Alfa Romeo: Some analyses show Alfa Romeo models in the lower quartile of pass rates, particularly older diesel variants. Sample sizes for some models are smaller, making conclusions less statistically robust.
- Certain Fiat and Chrysler-era group models: Specific older models show above-average failure rates on suspension and emissions, though newer Fiat models show improved performance.
It is critical to contextualise all manufacturer comparisons with age adjustment. A brand whose vehicles are disproportionately old in the fleet will show worse aggregate statistics than one whose vehicles are predominantly newer. The most meaningful comparisons control for age bracket, comparing ten-year-old examples of one brand against ten-year-old examples of another.
Historical Trend and COVID Impact
The long-run trend in MOT pass rates shows a gradual improvement over the decade prior to 2020, driven by newer vehicles entering the fleet and improvements in overall vehicle quality. The UK vehicle fleet was, on average, younger and better maintained in 2019 than it was in 2010. This translated into a modest improvement in first-time pass rates across the period.
The 2020 COVID Disruption and Its Long-Run Effect
The COVID-19 pandemic created a unique statistical disruption to MOT data. In March 2020, the UK Government introduced a six-month MOT exemption for vehicles due from 30 March 2020, extended to July 2020, allowing vehicles to remain legally on the road without a current MOT certificate. Testing volumes collapsed during the initial lockdown period and only partially recovered in the second half of 2020.
The statistical effect of this was significant and multi-year. A large cohort of vehicles that should have been tested in spring 2020 were instead tested in late 2020 or 2021, creating a compression in the test schedule that elevated volumes and, initially, pass rates (as the vehicles that chose to test earlier tended to be better maintained). The cohort of vehicles that deferred longest included a disproportionate number of less-maintained vehicles, which then entered the testing queue in 2021 with additional deferred wear. DVSA data from 2021 shows a measurable spike in certain failure categories, particularly suspension and structural corrosion, consistent with maintenance that was deferred during lockdown periods.
Year-on-Year Failure Rate Trend
Outside the COVID disruption period, the trend in first-time failure rates for cars has been broadly stable to marginally improving since approximately 2015. The 2018 MOT rule changes introduced a short-term apparent increase in recorded failures, primarily due to the new formal classification of Minor (advisory) items that were previously recorded informally or not at all. Once this reclassification effect is stripped out, the underlying trend shows modest annual improvements in pass rates of approximately 0.3 to 0.5 percentage points per year in the pre-pandemic period.
Post-pandemic, the failure rate trend has been influenced by two opposing forces: the progressive ageing of the fleet as new car sales remained below pre-pandemic levels in 2020 and 2021, and the improving reliability of vehicles entering the test age bracket from the 2018 to 2021 model year cohort. The net effect has been broadly stable failure rates in the 22 to 24 percent range for the car fleet.
DPF Removal and Emissions Enforcement
The DPF removal issue represents one of the most significant enforcement challenges the MOT regime has faced in recent years. From approximately 2010 onwards, a growing number of diesel vehicle owners began removing the diesel particulate filter from their cars to avoid regeneration problems, often paying specialist garages to physically remove the filter and remap the engine management system. The practice became more common from 2012 to 2015 as the first generation of DPF-equipped vehicles began to require expensive replacement filters.
The Scale of DPF Removal Before 2018
Before the 2018 rule change, a DPF-deleted vehicle could pass the MOT numerical emissions test if the engine was remapped to compensate for the removed filter. The visual smoke check was less consistently applied. As a result, a significant number of DPF-deleted vehicles were receiving valid MOT certificates despite being in clear breach of the Construction and Use Regulations. Estimates from DVSA and independent analyses suggested tens of thousands of vehicles on UK roads had illegally removed DPFs in the 2015 to 2018 period.
Post-2018 Enforcement and Its Statistical Effect
The 2018 rule change made DPF deletion an automatic visual failure: any diesel emitting visible smoke from the exhaust under a hard acceleration test fails immediately, regardless of the numerical results. This change produced an immediate increase in diesel emissions failures in 2018 and 2019 as vehicles that had previously received certificates began to fail under the new standard.
The post-2018 enforcement regime has also had a deterrent effect. The financial incentive to remove a DPF has declined because the vehicle will now fail the MOT regardless of whether the engine is remapped, making removal pointless from a certification perspective. Industry data suggests new DPF removal activity has fallen substantially since 2018, though a legacy population of already-removed DPFs continues to generate failures as these older vehicles cycle through the annual test.
Seasonal Variation in Pass Rates
MOT failure rates are not uniformly distributed across the calendar year. The data shows a consistent seasonal pattern that has been stable across multiple years of analysis.
Autumn: The Highest Failure Rate Season
September through November consistently shows the highest first-test failure rates of any quarter. Several factors contribute to this pattern. The days shorten in autumn, meaning vehicles are driven with lights on for more hours, increasing the rate at which bulb failures become apparent to testers (though not to drivers who fail to check). Summer driving accumulates mileage and heat stress on tyres, which can accelerate the rate of tread wear reaching the legal minimum in late summer or early autumn. Brake discs corrode more rapidly in the wetter conditions of early autumn, and the corrosion may be picked up for the first time if the vehicle was not tested recently.
There is also a compositional effect: many vehicles receive their annual test in autumn because they were first registered in the autumn months. This reflects the March and September new-car registration peaks in the UK. Vehicles first registered in September enter their MOT cycle in September three years later, creating a cohort of tests concentrated in the autumn months. To the extent that the September registration cohort has any systematic characteristics, this shapes the autumn failure statistics.
Spring and Summer: Marginally Better Pass Rates
The spring months, particularly March through May, tend to show slightly better first-time pass rates. Winter driving is over, meaning any damage from icy or wet roads has been absorbed by vehicles that survived to spring without a failure. Tyres fitted in autumn for winter safety are now several months old but typically not yet worn to the failure threshold. Lighting is used less in the longer days, reducing tester attention to borderline lamp output.
The practical implication is modest but real: if you have flexibility in when to book your MOT and your vehicle is borderline in condition, a spring test offers a marginally better statistical chance of passing first time. The effect is not dramatic, perhaps one to two percentage points, but it is consistent across multiple years of data.
Seasonal MOT test volumes: when does the UK test the most cars?
MOT test volumes follow a clear pattern driven by the UK new-car registration cycle. March and September are the two highest-volume registration months, meaning vehicles first registered in these months create peaks in MOT testing approximately three, four, and five years later. The result is that March and September also tend to be the highest-volume MOT testing months, as the first-test cohort is large and subsequent annual tests maintain that distribution.
January and February are typically the lowest-volume months for MOT testing, reflecting both the lower registration volumes in those months historically and the tendency for drivers to delay booking slightly into the new year. The practical effect of this volume variation is marginal for individual drivers but material for test centre capacity planning.
Test Centre Variation and DVSA Oversight
One of the less-discussed but statistically significant aspects of MOT failure data is the variation in pass rates between individual test centres. The DVSA publishes data that enables analysis of individual Authorised Testing Facility (ATF) and Vehicle Testing Station (VTS) performance, and the distribution shows a substantial spread around the national average.
Why Pass Rates Vary Between Test Centres
Genuine variation between test centres can arise from legitimate factors. A test centre in a wealthy area will test a disproportionately newer, better-maintained fleet and will naturally record higher pass rates. A test centre specialising in older vehicles or commercial vehicles will record lower pass rates. A test centre in a rural area with an older fleet and more corrosion issues will show different patterns from an urban centre.
However, the DVSA's analysis has identified a category of test centres where the pass rate is statistically anomalous even after controlling for fleet characteristics. Test centres with unusually high pass rates, particularly those located in areas where the fleet age and maintenance profile would predict average or below-average pass rates, are flagged for targeted monitoring.
DVSA Targeted Monitoring and the Ghost MOT Problem
The DVSA operates a targeted monitoring programme that deploys specialist teams to test centres identified as statistical outliers. Monitoring activities include covert testing using pre-checked vehicles (where the DVSA knows in advance what defects are present), analysis of testing times (a fraudulent test often takes far less time than a genuine one), and CCTV review where centres have surveillance systems in place.
The monitoring programme has resulted in prosecutions and certificate revocations across multiple testing years. The most serious category of fraud is the issuance of MOT certificates for vehicles that were never physically tested at the centre, sometimes known as ghost MOTs. In documented cases, certificates were issued for vehicles that were not present at the test centre, often as part of organised frauds involving vehicle traders who needed certificates for unroadworthy vehicles being sold to the public.
Ghost MOTs and Certificate Fraud: The Historical Record
The issue of fraudulent MOT certificates has a documented history stretching back to the early years of computerised testing. The introduction of the MOT computerised testing system (MCMS) in the early 2000s reduced the scope for some forms of fraud but created new vulnerabilities, particularly around certificate issuance.
Major Fraud Cases and Their Scale
Several major prosecutions for MOT fraud have been brought in the UK over the past fifteen years. In the most significant cases, networks of complicit testers and vehicle traders were found to have issued hundreds or thousands of certificates for vehicles that either failed a genuine inspection or were never inspected at all. The vehicles involved were typically older, high-mileage examples that would have failed a genuine test, being prepared for sale to buyers who trusted the valid-appearing certificate.
The DVSA has pursued prosecutions under both the Road Traffic Act and fraud legislation, with sentences in the most serious cases including custodial terms and lifetime bans from working in the vehicle testing industry. The agency has also revoked the testing authorisation of stations involved in fraud, removing their ability to conduct or certify MOT tests.
How to Verify an MOT Certificate is Genuine
- Use the official DVSA MOT history service at GOV.UK or our free MOT history checker to verify the certificate number, test date, and test station against the official database.
- Check that the test duration recorded in the history is plausible. A genuine MOT takes approximately 45 to 60 minutes for a car. A recorded test duration of under 20 minutes may indicate a fraudulent test.
- Cross-reference the test centre name and DVSA approval number on the certificate with the DVSA's registered test station list.
- Look at the pattern of pass and fail in the vehicle's full MOT history. A vehicle that has failed on multiple items in previous years but suddenly produced a clean pass at an unfamiliar test centre is worth scrutinising further.
- If buying a high-value vehicle, commission an independent pre-purchase inspection from a separate DVSA-registered tester to independently verify the vehicle's condition against the certificate.
Cost of Failures and the Advisory-to-Failure Pipeline
Understanding the economics of MOT failures requires looking not just at the cost of repairs, but at the relationship between advisories issued at one test and failures recorded at the next. This advisory-to-failure conversion rate is one of the most actionable statistics the DVSA data produces.
What Percentage of Advisories Become Failures?
Analysis of the DVSA's linked testing dataset, which tracks individual vehicles across consecutive tests, shows that advisory items have a significant probability of generating a failure if not addressed. The conversion rate varies by category:
- Tyre advisories (tread below 2mm but above 1.6mm): approximately 40 to 50 percent convert to a tyre failure within twelve months if no replacement is made
- Brake advisory items (pads approaching minimum, disc lipping): approximately 30 to 40 percent convert to a failure at the next annual test
- Suspension advisory items (worn bushes, deteriorating shock absorbers): approximately 25 to 35 percent convert to a failure, with the rate higher for items noted as close to the borderline
- Windscreen advisory items (chip near but not in primary field of vision): approximately 15 to 20 percent convert to a failure, depending on whether the chip propagates into a crack
These conversion rates make a compelling economic case for addressing advisories promptly rather than waiting for the next test. A tyre noted as having 2mm of tread in April should be replaced before October if the vehicle is used in normal winter driving conditions. A brake pad advisory noted in spring should be addressed before the next MOT, not ignored until the pad runs to the minimum and requires emergency replacement at a higher price.
The Cost Premium of Emergency Repair vs Planned Repair
Independent analysis of repair invoice data shows a consistent premium for repairs conducted on a same-day emergency basis following MOT failure versus the same repairs carried out as planned maintenance. The premium arises from parts availability, labour urgency, and the absence of competitive tendering when a vehicle is immobilised at a test centre. The emergency premium for common repair items is typically in the range of 15 to 35 percent over the equivalent planned repair cost. For complex repairs involving special-order parts, the premium can exceed 50 percent.
The conclusion is straightforward: an MOT advisory is not a deferral letter. It is a warning that a repair will be needed, and that the repair will cost more if left until the next test produces a failure. Addressing advisories within three months of receiving them is consistently the most cost-effective approach to vehicle maintenance.
Mileage Correlation and Fleet vs Private Owner Data
Mileage vs Failure Rate: What the Data Shows
Mileage is correlated with MOT failure rate, but the relationship is weaker than many drivers assume. The reason is that mileage and age are themselves correlated, and age is the stronger predictor of failure. A ten-year-old car with 40,000 miles has not been driven much, but its rubber suspension components, seals, and corrosion protection have still aged ten years regardless of mileage. A five-year-old car with 100,000 miles has high mileage but is still five years old, meaning its body structure and corrosion protection are relatively recent.
The correlation between mileage and failure rate is most pronounced in specific categories. Brake pad and disc wear is strongly mileage-correlated. Tyre tread depth is strongly mileage-correlated. Engine wear and associated emissions performance is mileage-correlated. But suspension bush perishing, structural corrosion, and bodywork deterioration are age-correlated rather than mileage-correlated. A low-mileage vehicle can fail on corrosion and suspension bushes just as readily as a high-mileage example of the same age if it has been stored or used in conditions that accelerate these failure modes.
Fleet vs Private Owner Failure Rates
Fleet vehicles, defined as those registered to companies and operated on company business, consistently show better first-time pass rates than equivalent-age privately owned vehicles. The difference is typically two to four percentage points across the age spectrum. Fleet vehicles tend to be serviced on strict manufacturer-specified intervals as a condition of fleet management contracts. They are typically replaced at three to four years old, meaning they rarely enter the higher-risk age brackets within corporate ownership.
When fleet vehicles are sold into the used market at three to four years old, they typically arrive with full service history and in good condition. However, the subsequent MOT history of ex-fleet vehicles shows a pattern of deterioration that tracks closely with the absence of the disciplined servicing regime they received under fleet ownership. Within two to three years of private ownership, the pass rate of ex-fleet vehicles converges toward the national average for their age group, suggesting that the fleet advantage largely reflects the servicing culture rather than any inherent vehicle quality difference.
MOT prediction modelling: can you forecast whether a vehicle will fail?
Several academic and commercial research projects have attempted to build predictive models for MOT failure using the open DVSA dataset. The most sophisticated of these models use machine learning techniques to identify combinations of vehicle characteristics, test history, and advisory patterns that are statistically predictive of future failure.
The results are instructive. The most reliable predictors of first-test failure in these models are: vehicle age (strongest predictor), number of advisories at the previous test (strong predictor), the specific categories of those advisories, fuel type (diesel slightly elevated for emissions), and region (captures fleet age and salt exposure). Manufacturer and model are statistically significant but explain less variance than the combination of age and advisory history.
The practical implication for vehicle owners is that the simplest form of failure prediction is already available: look at your previous MOT certificate's advisory column, assess the age and category of each advisory, and apply the conversion rates described above. No sophisticated algorithm is required to identify that a tyre advisory plus a brake advisory on a ten-year-old vehicle represents a meaningful risk of failure at the next test.
Pre-MOT Inspection: The Data-Supported Case
Given the statistical profile of MOT failures, a systematic pre-MOT inspection conducted one to two weeks before the test date is the single most effective intervention available to vehicle owners. The inspection allows time to order and fit parts before the test, avoiding both the emergency repair premium and the retest fee. The following checklist covers the highest-probability failure items based on the failure category data.
- Lights: With the ignition on, walk around the car and check every light. Sidelights, dipped headlights, full beam, front and rear fog lights, brake lights (use a wall reflection or ask someone to watch), reverse lights, and all indicators including the hazard lights.
- Tyres: Check the tread depth at multiple points across each tyre using a depth gauge. Check for sidewall damage, cuts, or bulges. Check that tyres on the same axle are the same type (matching sizes and construction).
- Windscreen: Look for chips or cracks in the area swept by the driver's side wiper. Any crack or chip larger than 10mm in the area directly in front of the driver is a failure. Chips up to 40mm elsewhere on the swept area are also failures.
- Wipers: Run the wipers with washer fluid and check for smearing, juddering, or incomplete coverage. Check that the washers jet fluid effectively.
- Horn: Test the horn. It must be audible and function when pressed.
- Brakes: Apply the brakes firmly from 20 mph in a safe location and check for pulling to one side, unusual vibration, or grinding noise. These are indicators of imbalance or pad wear and should prompt professional inspection.
- Previous advisories: Review the advisory items from the last MOT certificate. Any item noted as a potential future concern should be professionally inspected before the test.
Official Government Resources
The following official UK government sources provide authoritative information relevant to this topic:
The DVSA's annual Vehicle Testing Statistics publication is the primary source for all UK pass/fail rate data and is freely available via GOV.UK.
Frequently Asked Questions
What is the overall first-time MOT failure rate in the UK?
Which MOT failure category produces the most failures by volume?
How does failure rate vary between a 3-year-old and a 10-year-old vehicle?
Do diesel vehicles fail the MOT more than petrol vehicles?
How do EVs perform in the MOT compared to petrol and diesel cars?
Which regions of the UK have the highest MOT failure rates?
What happened to MOT statistics during and after COVID-19?
What percentage of advisories turn into failures at the next MOT?
Do some MOT test centres pass more vehicles than others, and does the DVSA monitor this?
How can I see a vehicle's full MOT failure and advisory history?
Planning a Car Purchase?
Knowing the national failure rates puts individual test outcomes in context — use our free checker to see exactly what categories a specific vehicle has failed on and compare against the UK averages.
MOT Check vs HPI — Full ComparisonRelated MOT Guides
What Is an MOT Test? Complete UK Guide (2026)
An MOT is an annual safety inspection required for all UK vehicles over three years old. It checks…
How Long Does an MOT Last? Certificate Duration Explained
An MOT certificate lasts exactly 12 months from the test date. You can renew up to one calendar…
Top 10 MOT Failure Reasons in the UK (2026 Data)
The most common MOT failure reasons are lighting faults (around 18% of failures), followed by…